Note: In this example there is a lot of code. You are not expected to know how to read any of this yet. This is just a preview of the things you will see in the next few weeks.
This is a Jupyter Notebook
A Jupyter Notebook is a document that combines:
Narrative: The text describing your analysis
Code: The program that does the analysis
Results: The output of the program
The Jupyter environment was created by faculty here at Berkeley (Fernando Perez). These ideas are now in a lot of different technologies (e.g., Google Colab).
Our first example: analyzing the text of Little Women
“Little Women” by Louisa May Alcott is the story of four sisters and their neighbor Laurie (Theodore Laurence).
To analyze it, we define a function that reads data from the Internet.
# A tiny program to download text from the web.
def read_url(url):
    from urllib.request import urlopen
    import re
    return re.sub('\\s+', ' ', urlopen(url).read().decode())
Here we download the book, which is hosted on the Data 8 textbook website.
little_women_url = 'https://www.inferentialthinking.com/data/little_women.txt'
little_women_text = read_url(little_women_url)
little_women_chapters = little_women_text.split('CHAPTER ')[1:]
Tables
A lot of data science is about transforming data. This is often in service of producing tables, a widely used data structure that we can more easily analyze our data with.
In this class you will use the
datasciencelibrary (specifically created for this course) to manipulate and data.
from datascience import *Table().with_column('Chapters', little_women_chapters)We will learn to visualize data
Most notebooks contain some setup for data manipulation and visualization. The details aren’t important, but an LM can tell you about them.
from datascience import *
import numpy as np
%matplotlib inline
import matplotlib.pyplot as plt
plt.style.use('fivethirtyeight')
import warnings
warnings.simplefilter(action="ignore", category=FutureWarning)
We can calculate the number of times Jo was mentioned in each chapter.
np.char.count(little_women_chapters, 'Jo')array([44, 21, 62, 34, 55, 13, 9, 71, 21, 12, 42, 60, 24, 48, 26, 13, 29,
35, 5, 29, 67, 17, 51, 36, 12, 17, 28, 69, 49, 39, 7, 60, 2, 55,
42, 35, 5, 47, 15, 15, 17, 36, 61, 9, 6, 56, 37])How about the other characters? We could build a table.
# Counts of names in the chapters of Little Women

names = ['Amy', 'Beth', 'Jo', 'Laurie', 'Meg']
mentions = {name: np.char.count(little_women_chapters, name) for name in names}

counts = Table().with_columns([
        'Amy',    mentions['Amy'],
        'Beth',   mentions['Beth'],
        'Jo',     mentions['Jo'],
        'Laurie', mentions['Laurie'],
        'Meg',    mentions['Meg']
    ])
countsWe can accumulate the counts for each character to show the total in the book so far.
cumulative_counts = Table()
for label in counts.labels:
    cumulative_counts = cumulative_counts.with_column(label, np.cumsum(counts.column(label)))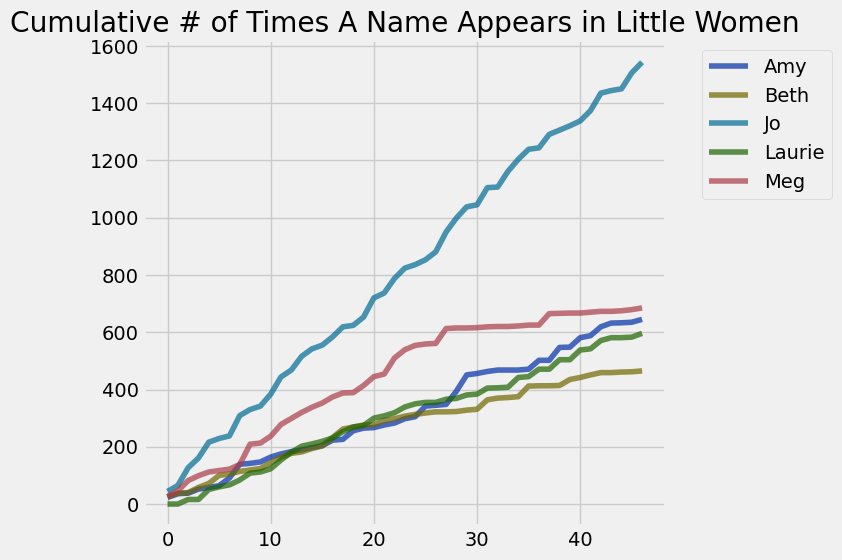
cumulative_countsAnd then to study these numbers we can create a line chart of cumulative counts.
cumulative_counts.plot()
plt.title('Cumulative # of Times A Name Appears in Little Women')
plt.show()