import matplotlib
from datascience import *
%matplotlib inline
import matplotlib.pyplot as plots
import numpy as np
plots.style.use('fivethirtyeight')
New material
Choosing a sample size given an interval width
# population of size 10

number_of_ones = 2
zero_one_population = np.append(np.ones(number_of_ones), np.zeros(10 - number_of_ones))

print('Standard Deviation:', np.round(np.std(zero_one_population),2))

zero_one_population
Standard Deviation: 0.4
array([ 1., 1., 0., 0., 0., 0., 0., 0., 0., 0.])def sd_of_zero_one_population(number_of_ones):
"""Returns the SD of a population
that has 10 elements: num_ones with value 1 and (10 - num_ones) with value 0"""
zero_one_population = np.append(np.ones(number_of_ones),
np.zeros(10 - number_of_ones))
return np.std(zero_one_population)possible_ones = np.arange(11)
zero_one_pop = Table().with_columns(
'Number of Ones', possible_ones,
'Proportion of Ones', possible_ones / 10
)
zero_one_pop.show()Loading...
sds = zero_one_pop.apply(sd_of_zero_one_population, 'Number of Ones')
zero_one_pop = zero_one_pop.with_column('Pop SD', sds)
zero_one_pop.show()
Loading...
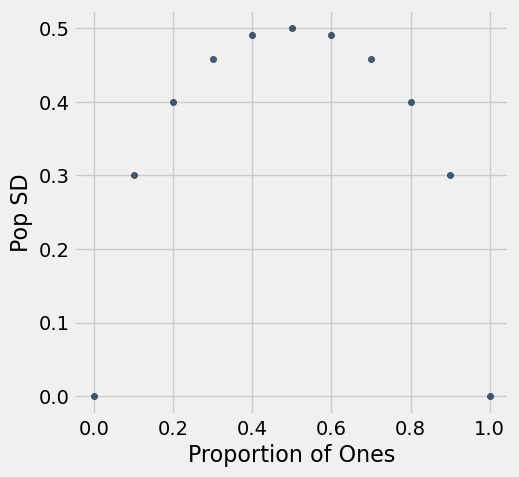
zero_one_pop.scatter('Proportion of Ones', 'Pop SD')