# Initialize Otter
import otter
grader = otter.Notebook("hw02.ipynb")
Homework 2: Arrays and Tables
Please complete this notebook by filling in the cells provided. Before you begin, execute the previous cell to load the provided tests.
Helpful Resource:
Python Reference: Cheat sheet of helpful array & table methods used in Data 8!
Recommended Readings:
For all problems that you must write explanations and sentences for, you must provide your answer in the designated space. Moreover, throughout this homework and all future ones, please be sure to not re-assign variables throughout the notebook! For example, if you use max_temperature in your answer to one question, do not reassign it later on. Otherwise, you will fail tests that you thought you were passing previously!
Deadline:
This assignment is due Wednesday, 2/4 at 11:00am PT. Submissions after this time will be accepted for 24 hours and will incur a 20% penalty. Any submissions later than this 24 hour period will not be accepted unless an extension has been granted as per the syllabus page. Turn it in by Tuesday, 2/3 at 11:00am PT for 5 extra credit points.
Directly sharing answers is not okay, but discussing problems with the course staff or with other students is encouraged. Refer to the syllabus page to learn more about how to learn cooperatively.
You should start early so that you have time to get help if you’re stuck. Office hours are held Monday through Friday in Warren Hall 101B. The office hours schedule appears on https://
# Run this cell and ignore the output. It is checking to see if you ran the first cell!
# If you get a NameError, please run the cell at the very TOP of this notebook!

grader
# Run this cell to set up the notebook, but please don't change it.
import numpy as np
from datascience import *
import warnings
warnings.simplefilter('ignore', FutureWarning)
# These lines do some fancy plotting magic.\n",
import matplotlib
%matplotlib inline
import matplotlib.pyplot as plt
plt.style.use('fivethirtyeight')
# No need to worry about what this code means
from IPython.display import Javascript, display
display(Javascript(r"""
(() => {
function pathLooksLikeTyping(e) {
const path = e.composedPath ? e.composedPath() : [];
for (const n of path) {
if (!n) continue;
if (n.tagName === 'INPUT' || n.tagName === 'TEXTAREA') return true;
if (n.isContentEditable) return true;
const role = n.getAttribute?.('role');
if (role === 'textbox' || role === 'combobox' || role === 'searchbox') return true;
const ariaMulti = n.getAttribute?.('aria-multiline');
if (ariaMulti === 'true') return true;
const cls = (n.className || "").toString().toLowerCase();
}
return false;
}
function handler(e) {
if (e.key !== 'o' && e.key !== 'O') return;
if (pathLooksLikeTyping(e)) {
e.stopPropagation();
if (e.stopImmediatePropagation) e.stopImmediatePropagation();
if (e.nativeEvent?.stopImmediatePropagation) e.nativeEvent.stopImmediatePropagation();
return;
}
e.preventDefault();
e.stopPropagation();
if (e.stopImmediatePropagation) e.stopImmediatePropagation();
if (e.nativeEvent?.stopImmediatePropagation) e.nativeEvent.stopImmediatePropagation();
}
window.addEventListener('keydown', handler, true);
window.addEventListener('keypress', handler, true);
console.log("Installed: 'o' won't toggle output; 'o' should type inside any textbox-like UI (including JupyTutor).");
})();
"""))These exercises give you practice on accessing individual elements of arrays. In Python, each element is accessed by its index. An index indicates the position of an element within an array. For example, the first element is the element at index 0. Indices must be integers.
Note: If you have previous coding experience, you may be familiar with bracket notation. DO NOT use bracket notation when indexing (i.e. arr[0]).
Be sure to refer to the Python Reference on the website if you feel stuck!
Question 1.1. The cell below creates an array of some numbers. Set third_element to the third element of some_numbers using item. (3 Points)
Hint: Remember that the first element is at index 0, the second element is at index 1, and so on!
some_numbers = make_array(-1, -3, -6, -10, -15)

third_element = ...
third_elementgrader.check("q1_1")Question 1.2. The next cell creates a table that displays some information about the elements of some_numbers and their order. Run the cell to see the partially-completed table, then fill in the missing information (the cells that say “Ellipsis”) by assigning blank_a, blank_b, blank_c, and blank_d to the correct elements in the table. (4 Points)
Note: Replace the ... with strings or numbers. As a reminder, indices should be integers.
Hint: If you’re confused about which location corresponds to each blank, try filling in one blank and seeing how the table changes!
blank_a = ...
blank_b = ...
blank_c = ...
blank_d = ...
elements_of_some_numbers = Table().with_columns(
    "English name for position", make_array("first", "second", blank_a, blank_b, "fifth"),
    "Index",                     make_array(blank_c, 1, 2, blank_d, 4),
    "Element",                   some_numbers)
elements_of_some_numbersgrader.check("q1_2")Question 1.3. You’ll sometimes want to find the last element of an array. Suppose an array has 142 elements. What is the index of its last element? (3 Points)
Note: Your answer must be a positive integer. An integer is a whole number that does not include fractions or decimals.
index_of_last_element = ...grader.check("q1_3")More often, you don’t know the number of elements in an array, which is its length. (For example, it might be a large dataset you found on the Internet.) The function len takes a single argument, an array, and returns an integer that represents the length of that array. You can see an example of len here:
#Creating an array with five elements
five_element_array = make_array(1, 2, 3, 4, 5)

#Finding the length of the array, which is 5!
len(five_element_array)
Question 1.4. The cell below loads an array called president_birth_years. Calling tbl.column(...) on a table returns an array of the column specified, in this case the Birth Year column of the president_births table. The last element in that array is the most recent among the birth years of all the deceased Presidents. Assign that year to most_recent_birth_year. (4 Points)
Note: Do not Google the answer. You should be able to answer this question only using array methods.
president_birth_years = Table.read_table("president_births.csv").column('Birth Year')

most_recent_birth_year = ...
most_recent_birth_yeargrader.check("q1_4")Question 1.5. Finally, assign min_of_birth_years to the minimum of the first, sixteenth, and last birth years listed in president_birth_years. (4 Points)
Note: Use the Python min function and table methods to find the answer. Do not manually calculate the result yourself!
min_of_birth_years = ...
min_of_birth_yearsgrader.check("q1_5")Question 2.1. Multiply the numbers 42, -4224, 424224242, and 250 by 157. Assign each variable below such that first_product is assigned to the result of , second_product is assigned to the result of , and so on. (3 Points)
Note: For this question, don’t use arrays.
first_product = ...
second_product = ...
third_product = ...
fourth_product = ...
print("First Product:", first_product)
print("Second Product:", second_product)
print("Third Product:", third_product)
print("Fourth Product:", fourth_product)grader.check("q2_1")Question 2.2. Now, do the same calculation, but using an array called numbers and only a single multiplication (*) operator. Store the 4 results in an array named products. (3 Points)
numbers = ...
products = ...
productsgrader.check("q2_2")Question 2.3. Oops, we made a typo! Instead of 157, we wanted to multiply each number by 1577. Compute the correct products in the cell below using array arithmetic. Notice that your job is really easy if you previously defined an array containing the 4 numbers. (3 Points)
correct_products = ...
correct_productsgrader.check("q2_3")Question 2.4. We’ve loaded an array of temperatures in the next cell. Each number is the highest temperature observed on a day at a climate observation station, mostly from the US. Since they’re from the US government agency NOAA, all the temperatures are in Fahrenheit.
Convert all the temperatures to Celsius by first subtracting 32 from them, then multiplying the results by , i.e. . After converting the temperatures to Celsius, make sure to ROUND the final result to the nearest integer using the np.round function. (4 Points)
max_temperatures = Table.read_table("temperatures.csv").column("Daily Max Temperature")

max_temperatures_celsius = ...
celsius_temps_rounded = ...
celsius_temps_roundedgrader.check("q2_4")Question 2.5. The cell below loads all the lowest temperatures from each day (in Fahrenheit). Compute the daily temperature range for each day. That is, compute the difference between each daily maximum temperature and the corresponding daily minimum temperature. Pay attention to the units and give your answer in Celsius! Make sure NOT to round your answer for this question! (3 Points)
Hint: Use min_temperatures and/or max_temperatures, and be careful with when you perform your unit conversions. Write out the mathematical computation by hand if you’re stuck!
min_temperatures = Table.read_table("temperatures.csv").column("Daily Min Temperature")

celsius_temperature_ranges = ...
celsius_temperature_rangesgrader.check("q2_5")Old Faithful is a geyser in Yellowstone that erupts every 44 to 125 minutes (according to Wikipedia). People are often told that the geyser erupts every hour, but in fact the waiting time between eruptions is more variable. Let’s take a look.
Question 3.1. The first line below assigns waiting_times to an array of 272 consecutive waiting times between eruptions, taken from a classic 1938 dataset. Assign the names shortest, longest, and average so that the print statement is correct. (4 Points)
waiting_times = Table.read_table('old_faithful.csv').column('waiting')

shortest = ...
longest = ...
average = ...

print("Old Faithful erupts every", shortest, "to", longest, "minutes and every", average, "minutes on average.")grader.check("q3_1")Question 3.2. Assign biggest_decrease to the biggest decrease in waiting time between two consecutive eruptions. For example, the third eruption occurred after 74 minutes and the fourth after 62 minutes, so the decrease in waiting time was 74 - 62 = 12 minutes. (4 Points)
Hint: We want to return the absolute value of the biggest decrease.
Note: np.diff() calculates the difference between subsequent values in an array. For example, calling np.diff() on the array make_array(1, 8, 3, 5) evaluates to array([8 - 1, 3 - 8, 5 - 3]), or array([7, -5, 2]). In this array, the biggest decrease would be from the second eruption to the third eruption.
# np.diff() calculates the difference between subsequent values in a NumPy array
# where the first value is subtracted from the second value

differences = np.diff(waiting_times)
biggest_decrease = ...
biggest_decreasegrader.check("q3_2")Question 3.3. The faithful_with_eruption_nums table contains two columns: eruption_number, which represents the number of that eruption, and waiting, which represents the time spent waiting after that eruption. For example, take the first two rows of the table:
| eruption number | waiting |
|---|---|
| 1 | 79 |
| 2 | 54 |
We can read this as follows: after the first eruption, we waited 79 minutes for the second eruption. Then, after the second eruption, we waited 54 minutes for the third eruption.
Suppose Dylan and Tim started watching Old Faithful at the start of the first eruption. Assume that they watch until the end of the tenth eruption. For some of that time they will be watching eruptions, and for the rest of the time they will be waiting for Old Faithful to erupt. How many minutes will they spend waiting for eruptions? (4 Points)
Hint #1: You can start by using the take method on the table faithful_with_eruption_nums.
Hint #2: first_nine_waiting_times must be an array.
# The following two lines load in our faithful_with_eruption_nums table
faithful = Table.read_table('old_faithful.csv').drop("eruptions")
faithful_with_eruption_nums = faithful.with_column("eruption number", np.arange(faithful.num_rows) + 1).select(1, 0)

first_nine_waiting_times = ...
total_waiting_time_until_tenth = ...
total_waiting_time_until_tenthgrader.check("q3_3")Question 3.4. Let’s imagine your guess for the next waiting time was always just the length of the previous waiting time. If you always guessed the previous waiting time, how big would your error in guessing the waiting times be, on average? (4 Points)
For example, since the first four waiting times are 79, 54, 74, and 62, the average difference between your guess and the actual time for just the second, third, and fourth eruptions would be .
differences = np.diff(waiting_times)
average_error = ...
average_errorgrader.check("q3_4")Question 4.1. Suppose you have 4 apples, 3 oranges, and 3 pineapples. (Perhaps you’re using Python to solve a high school Algebra problem.) Create a table that contains this information. It should have two columns: fruit name and amount. Assign the new table to the variable fruits. (4 Points)
Note: Use lower-case and singular words for the name of each fruit, like "apple".
Note: Review Chapter 6 if you get stuck!
# Our solution uses 1 statement split over 3 lines.
fruits = ...
        ...
        ...
fruitsgrader.check("q4_1")Question 4.2. The file inventory.csv contains information about the inventory at a fruit stand. Each row represents the contents of one box of fruit. Load it as a table named inventory using the Table.read_table() function. Table.read_table(...) takes one argument (data file name in string format) and returns a table. (4 Points)
inventory = ...
inventorygrader.check("q4_2")Question 4.3. Does each box at the fruit stand contain a different fruit? Set all_different to True if each box contains a different fruit or to False if multiple boxes contain the same fruit. (4 Points)
Hint: You don’t have to write code to calculate the True/False value for all_different. Just look at the inventory table and assign all_different to either True or False according to what you can see from the table in answering the question.
Note: Make sure to capitalize True and False!
all_different = ...
all_differentgrader.check("q4_3")Question 4.4. The file sales.csv contains the number of fruit sold from each box last Saturday. It has an extra column called price per fruit ($) that’s the price per item of fruit for fruit in that box. The rows are in the same order as the inventory table. Load these data into a table called sales. (5 Points)
sales = ...
salesgrader.check("q4_4")Question 4.5. How many fruits did the store sell in total on that day? (5 Points)
total_fruits_sold = ...
total_fruits_soldgrader.check("q4_5")Question 4.6. What was the store’s total revenue (the total price of all fruits sold) on that day? (5 Points)
Hint: If you’re stuck, think first about how you would compute the total revenue from just the grape sales.
total_revenue = ...
total_revenuegrader.check("q4_6")Question 4.7. Make a new table called remaining_inventory. It should have the same rows and columns as inventory, except that the amount of fruit sold from each box should be subtracted from that box’s original count, so that the count column is updated to be the amount of fruit remaining after Saturday. (5 Points)
remaining_inventory = ...
    ...
    ...
    ...
remaining_inventorygrader.check("q4_7")The Great Recession of 2008-2009 was a period of economic decline observed globally, with scale and timing varying from country to country. In the United States, it resulted in a rapid rise in unemployment that affected industries and population groups to different extents.
The Federal Reserve Bank of St. Louis publishes data about jobs in the US. Below, we’ve loaded data on unemployment in the United States. There are many ways of defining unemployment, and our dataset includes two notions of the unemployment rate:
Non-Employment Index (or NEI): Among people who are able to work and are looking for a full-time job, the percentage who can’t find a job.
NEI-PTER: Among people who are able to work and are looking for a full-time job, the percentage who can’t find any job or are only working at a part-time job. The latter group is called “Part-Time for Economic Reasons”, so the acronym for this index is NEI-PTER. (Economists are great at marketing.)
The source of the data is here.
Question 5.1. The data are in a CSV file called unemployment.csv. Load that file into a table called unemployment. (1 Point)
Hint: After loading in the CSV file, the unemployment table should look like this:
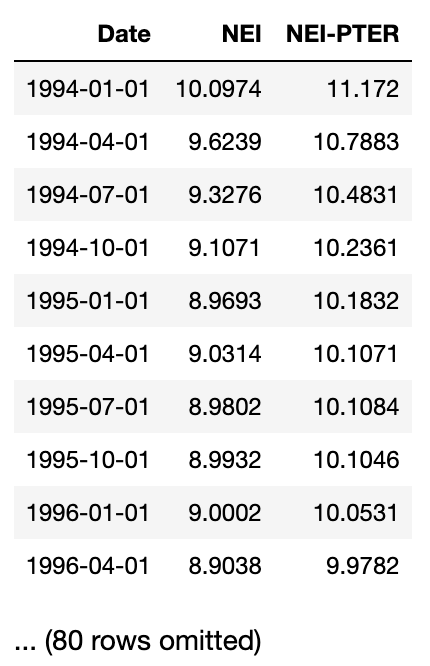
unemployment = ...
unemploymentgrader.check("q5_1")Question 5.2. Sort the data in descending order by NEI, naming the sorted table by_nei. Create another table called by_nei_pter that’s sorted in descending order by NEI-PTER instead. (4 Points)
by_nei = ...
by_nei_pter = ...grader.check("q5_2")# Run this cell to check your by_nei table. You do not need to change the code.
by_nei.show(5)# Run this cell to check your by_nei_pter table. You do not need to change the code.
by_nei_pter.show(5)Question 5.3. Using take, assign greatest_nei to a table containing the data for the 11 quarters when NEI was greatest.
greatest_nei should be sorted in descending order of NEI. Note that each row of unemployment represents a quarter. (2 Points)
greatest_nei = ...
greatest_neigrader.check("q5_3")Question 5.4. It’s believed that many people became PTER (recall: “Part-Time for Economic Reasons”) in the “Great Recession” of 2008-2009. NEI-PTER is the percentage of people who are unemployed (included in the NEI) plus the percentage of people who are PTER.
Compute an array containing the percentage of people who were PTER in each quarter. (The first element of the array should correspond to the first row of unemployment, and so on.) (3 Points)
Note: Use the original unemployment table for this.
pter = ...
ptergrader.check("q5_4")Question 5.5. Add pter as a column to unemployment (name the column PTER) and sort the resulting table by that column in descending order. Call the resulting table by_pter.
Try to do this with a single line of code, if you can. (3 Points)
by_pter = ...
by_ptergrader.check("q5_5")Question 5.6. Create a line plot of PTER over time. To do this, create a new table called pter_over_time with the same columns as the unemployment table with the addition of two new columns: Year and PTER using the year array and the pter array, respectively. Then, generate a line plot using one of the table methods you’ve learned in class.
The order of the columns matter for our correctness tests, so be sure Year comes before PTER. (4 Points)
Note: When constructing pter_over_time, do not just add the year column to the by_pter table. Please follow the directions in the question above.
year = 1994 + np.arange(by_pter.num_rows)/4
pter_over_time = ...
...
plt.ylim(0,2); # Do not change this linegrader.check("q5_6")Question 5.7. Were PTER rates high during the Great Recession (that is to say, were PTER rates particularly high in the years 2008 through 2011)? Assign highPTER to True if you think PTER rates were high in this period, or False if you think they weren’t. (1 Points)
highPTER = ...grader.check("q5_7")You’re done with Homework 2!
Important submission information: Be sure to run the tests and verify that they all pass, then choose Save Notebook from the File menu, then run the final cell and click the link to download the zip file. Then, go to Pensieve and submit the zip file to the corresponding assignment. The name of this assignment is “Homework 02 Autograder”. It is your responsibility to make sure your work is saved before running the last cell.
Once you have submitted, your Pensieve assignment should show you passing all the tests you passed in your assignment notebook.
Pets of Data 8
Nico is proud of you for completing another homework!

Congrats on finishing Homework 2!
To double-check your work, the cell below will rerun all of the autograder tests.
grader.check_all()Submission
Make sure you have run all cells in your notebook in order before running the cell below, so that all images/graphs appear in the output. The cell below will generate a zip file for you to submit. Please save before exporting!
# Save your notebook first, then run this cell to export your submission.
grader.export(pdf=False)